Financial Highlights
|
The 80th Business Term Ended October 2023 |
The 81th Business Term Ended October 2024 |
The 82th Business Term Ended October 2025 |
|
|---|---|---|---|
| Net sales (Millions of yen) | 298,623 | 308,382 | 304,123 |
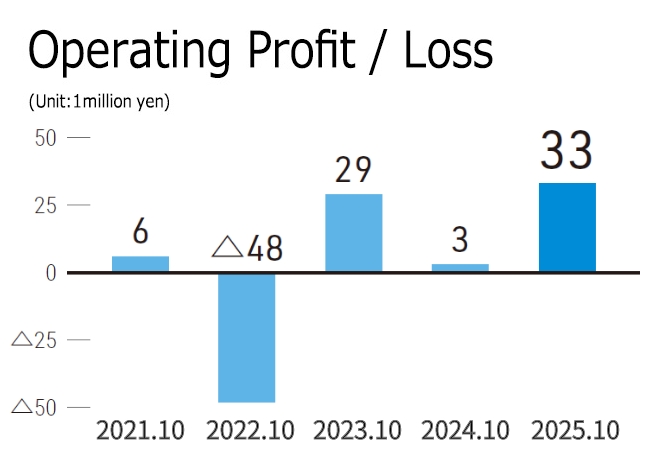
| Ordinary profit / loss (Millions of yen) | 5,327 | 2,727 | 7,272 |
| Profit / Loss attributable to owners of parent(Millions of yen) | △2,991 | 1.973 | 8,419 |
| Net assets (Millions of yen) | 191,179 | 184,587 | 191,692 |
| Total assets (Millions of yen) | 280,994 | 270,260 | 276,997 |
| Net assets per share (Yen) | 4,675.33 | 4,503.79 | 4,737.56 |
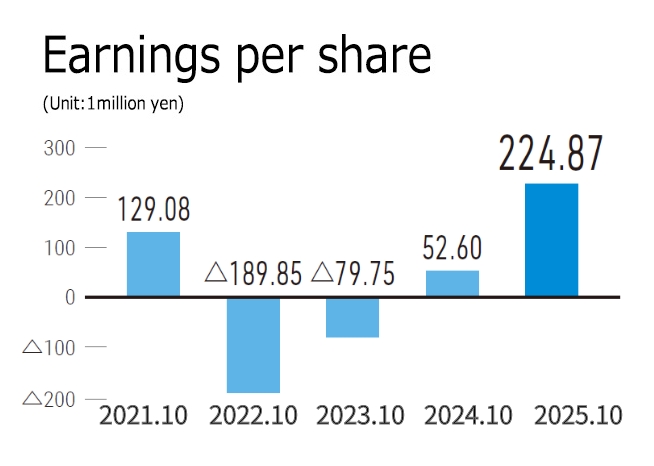
| Basic earnings / loss per share(Yen) | △79.75 | 52.60 | 224.87 |
| Diluted earnings per share (Yen) | ― | 52.58 | 224.78 |
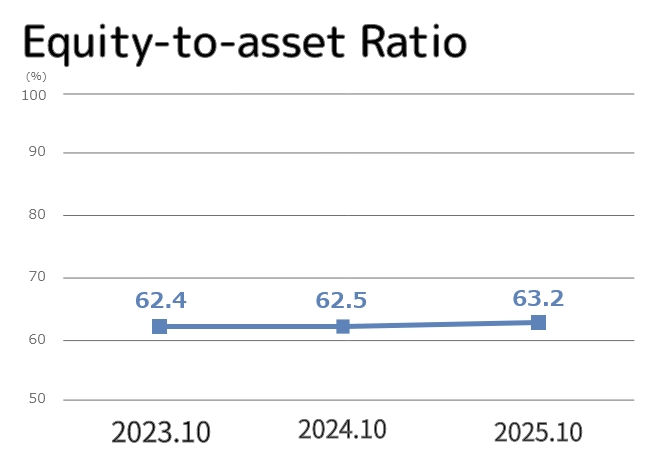
| Equity-to-asset ratio(%) | 62.4 | 62.5 | 63.2 |
| Rate of return on equity(%) | ― | 1.1 | 4.9 |
| Price-earnings ratio(Times) | ― | 29.51 | 12.76 |
| Net cash provided by (used in) operating activities (Millions of yen) | 16,913 | 11,813 | 12,023 |
| Net cash provided by (used in) investing activities (Millions of yen) | △11,353 | 445 | 665 |
| Net cash provided by (used in) financing activities(Millions of yen) | △4,258 | △4,522 | △6,892 |
| Cash and cash equivalents at the end of period (Millions of yen) | 41,554 | 48,476 | 54,684 |
| Number of employees(Number of people) | 13,002 | 12,092 | 12,071 |